Monday, March 30, 2009

Window Basics

Maybe I should have posted this before my previous post since the ability to manage windows will be an advantage to get the most from Metatrader 4. So for those of you who are already masters of windows, you can skip this but for those who are new to windows, this post gives all the basic mastering window skills. It is actually much easier than it sounds.

For every window opened, there will be 3 possible main actions as shown by the 3 icons in the right hand top corner of the window. They are in order from left to right, Minimize, Maximize/Restore Down and Close. The Restore Down icon will appear if the window is already maximized (i.e. in full screen) and the Maximize icon will appear if the window can be manipulated, usually not in full screen.


When a Window is maximized, it will fill the whole screen. To restore to previous size (or Restore Down) click the middle icon and the window will restore to its previous size for you to manipulate the window as you cannot manipulate a window that is Maximised. You can drag the window to a new position by placing your cursor on the top title bar and holding down your left mouse button. By putting your cursor at the sides of the window, it will change into a double headed arrow and you can adjust the size by dragging the edge in either direction of the arrow while holding down the left mouse button. This will work on any of the four sides of the window.

When you press the Minimize icon, the window will disappear and appear as a tab in the bottom task bar or at the bottom of the program window. Click on the tab and it will open that window again. But if you Close the window by clicking the X icon, the window will be closed and removed and it cannot be reopened again.

We can open multiple windows in any one session. How do we use this in Metatrader 4? You can create many charts or windows on one screen and by adjusting the sizes of these windows, you can arrange them in any configurations, such as side by side, one on top of another, in a 2 x 2 formation and so on. It is really up to you and how you want to see the information comfortably. For example, you may want to have an overview of the market by having a chart each of EURUSD, GBPUSD, USDCHF and USDJPY place in a 2 x 2 formation. Or to have a detail look at just the EURUSD market simultaneously by having 3 charts of this pair at different time frame side by side. You can also just have one chart of EURUSD and change the timeframe accordingly as desired but this is not the same as looking at 3 timeframes at once. Once you have your charts in the formation that you want, you can then save them as a new Profile and recall the different Profiles the next time you open Metatrader 4.

Bear in mind that though you can see several windows at once, only one window is active at any one time and any action taken will apply only to that window. The active window is indicated by a red background in the Close or X icon.
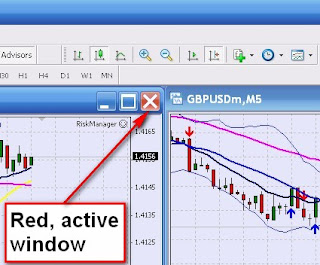
In the case of Metatrader 4, the active window will also have its tab shown in white background among the rest that are in grey. Click on any of the grey tab and it will turn white and that window will become the active window. Alternatively, you can just click on any opened window that is visible and it will become the active window.

While at Metatrader 4, sometimes your active window or chart is maximize and fills the whole available space and there is no window icon visible. Do not worry, look at the extreme top left corner of Metatrader menu bar and you will see a Window Menu icon.

Click on this and the drop down Window Menu will appear and you can select Restore to bring all the windows from the Maximized mode to the Restore Down mode. While the windows are in Restore Down mode, that Window Menu icon will not appear. Once you maximize one window, all the rest of the windows will also be maximized and you select each window by clicking on its tab at the bottom of the window. Conversely, once you Restore Down one window, all the windows will be restored to their previous sizes.

When you add indicators to a main Metatrader 4 chart, many of them will appear separately in a sub-window below the main chart and these are part of the main window. Their heights can be adjusted by placing the cursor at any of the boundaries and dragging it up or down.


At times in Metatrader 4, you may find that a window has gone to far down and you cannot access the bottom edge of a window to bring it up (to reduce the height). What you can do is to reduce the height from the top, then adjust the window position and finally access the bottom edge when it becomes visible.

Once you master these basic window skills, you will be able to manipulate the charts to your advantage by having all the information that you need for better trading. Have fun and happy trading.


Ronald Kwok
http://cbpirate.com/s/cbp/ronaldkwok


Saturday, March 28, 2009

Metatrader 4 Toolbars

As noted in my Forex Trading Blog, here is my new Blog all about Metatrader 4, for beginners. Comments are most welcome.

So you have opened a demo account and you have downloaded Metatrader 4. What's next? Start trading! But before you can do that you need to create your first chart. Here are the steps.

1. Select New Chart from the tool bar or from the File drop down menu.
2. Choose the currency pair from the list shown. The one hour (H1) chart will be shown by default.
3. Click the Candlestick to display chart in candlestick.


4. Right click anywhere in the chart and select Properties from the dropdown menu. You can change the colours and other settings for the chart to suit your liking.


5. You can add objects and technical indicators to your chart.
6. Save your chart as a new Profile with a unique name or it will take the Default name.

To make it easier for you, below are description of the various toolbars of Metatrader 4.

There are 3 main toolbar groups so I’ll just name them as Windows, Charts and Objects for easy reference and refer to each individual tool by an initial and a number thus W1, C2, O3, etc. in order of their appearance in the toolbar.


W1 – New Chart. Use this to create a new chart. Click on this and a list of 6 major currency pairs will appear with some additional pairs under MiniForex. The number of additional currency pairs differs from demo account to live accounts. Click on the pair you want and a new chart will appear in a new window.
W2 – Profiles. A profile is a chart with all its objects and indicators or a collection of several charts. The Default profile will load the first time MT4 is opened and any changes made will be saved as the Default profile and open the next time unless you save the changes with a new Profile name. You can create and remove profiles as you wish and switch to any Profile saved but the Default Profile cannot be deleted.
W3 – Market Watch. Click on this and the list of currency pairs available with the bid and ask prices will appear in a vertical window on the left. Double click on any currency pair and the Order window will open.
W4 – Data Window. Click on this and a window will appear on the left. Move your cursor to any candle in a chart and all the data available of the candle will appear.
W5 – Navigator. Click on this a window will appear on the left. Here you can select your account, indicators (technical), custom indicators, expert advisor and the scripts to be run.
W6 – Terminal. Click on this and a new window will appear at the bottom. Here you see your trade, the account history, news, mailbox, etc.
W7 – Click on this and a new window will appear at the bottom. This is for testing the Expert Advisors.
W8 – New Order. Click on this, the Order window will appear, just like pressing F9. The currency pair shown will be the one in the current active chart.
W9 – Meta Editor. This will open a new window to edit, Expert Advisors, custom indicators and scripts. For programmers only.
W10 – Expert Advisors. Click on this to enable or disable the Expert Advisors.

Opened windows can be closed by clicking the close window icon, i.e. the x.

Charts Toolbar

C1 – Bar Chart
C2 – Candlestick Chart
C3 – Line Chart
Click on any of these will change the type of the active chart.
C4 – Zoom In
C5 – Zoom Out
Click to zoom in or zoom out the chart as desired, there are 5 levels of Zoom.
C6 – Auto Scroll. If selected, the latest bar will always be shown on the screen. To see older bars, deselect this.
C7 – Chart Shift. Select this to shift the chart to the shift label (a small grey triangle in the upper part of the window).
C8 – Indicators. You can click this to select any indicators instead of using the Navigator window.
C9 – Periods. You can select the period of the active chart from 1 minute (M1) to Monthly (MN). You can also do this by clicking on the Period Toolbar.
C10 – Templates. Click on this to load, save or delete templates as desired.

Items added to a chart are either Objects or Indicators. The Object Toolbars shows the tools available.


O1 – Cursor. This is the standard arrow cursor by default for selecting items.
O2 – Crosshair. Select Crosshair. Move to active chart window and select first point. Press and hold down left mouse button and move to second point. A line connecting the two points will be drawn and the data between the two points will be shown as number of bars/number of pips/price at the second point. Release the left mouse button and all will disappear.
O3 – Vertical Line. Select tool, place at desire position. To make changes, double click to select line and handles (two small white squares) will appear. You can drag to new position or right click near line to access line properties to make changes. Double click after making changes to remove handles. For placing line at a particular time.
O4 – Horizontal Line. Same as above but for drawing horizontal line. Usually for drawing Support and Resistance levels.
O5 – Trendline. For drawing a slanting or trend line. Select tool. Place at first point, hold down left mouse button and select second point for the line. Trend line will snap to nearest point. To check if proper point is selected, double click to show the handles. There will be three handles, the middle one can be dragged to move the whole line while the handles at the two ends are attached to the ends of candles and they can be moved so that they snap and attached automatically at the ends of a candle.
O6 – Equidistant Channels. The usage is almost the same as O5 drawing the Trendline except that a second line is drawn parallel to the first line. Double click on the lines to select it and shows the handles. There will be three for the initial line (just like the Trendline above) and one handle for the second parallel line. Drag this handle by holding down the left mouse button and snap it to the desired extreme point and you will have a channel.
O7 – Fibonacci Retracement. Click on this tool and select the first point. Hold down the left mouse button and select the second point. It will snap into position and the Fibonacci retracement lines will be drawn. Select the main line and there will be three handles just like the trendlines and you can make similar adjustment by dragging the handles.
O8 – Text. Select this tool and you can place text anywhere in the active chart. This is attached to the chart and will move with the chart.
O9 – Text Label. Select this tool and you can put a label anywhere in the active window. This is attached to the window and will not move when the chart is scrolled.
O10 – Arrows. Select this to inset not just arrows but other graphical signs in the charts.

Finally there is the Period Toolbar which you click to select the timeframe from one minute (M1) to monthly (MN).

I think this is sufficient to get you moving. In my later posts I will give more details of some of the functions. Or better still, you may ask any questions on Metatrader 4 so that I can answer (wherever possible) in my posts. Happy trading.

Ronald Kwok
http://ronaldkwok.atomicblog.hop.clickbank.net/