No, I have not given up on Forex and moved on to properties investment and options trading! This post is on setting properties and options for charts, objects and indicators. In other words, basic tips on handling and changing properties of these common items that are used in Metatrader 4. Once you understand the basics, it will be very easy to change the properties and attributes of any chart, object and indicator and these are all the items you look at in Metatrader 4 before making a trade.
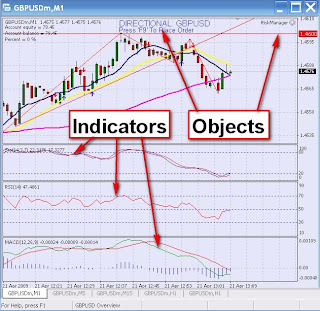
Just a brief definition here. Charts are either Bar, Candlestick or Line charts that will appear in the main window. Indicators are technical indicators (either built-in or custom made) that can be employed from the Navigator window while Objects are items (lines, graphical objects, labels, text, etc.) that are added onto the Charts or the Indicator windows. Anything added that is not appearing in the Navigator Indicators list are Objects under Metrader 4 and these include Channels, Andrew Pitchfork, Fibonacci Retracement and Extension.
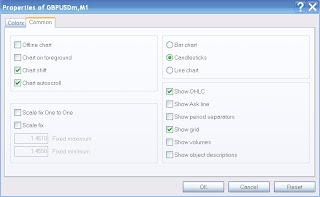
When you left click on any charts, a windows with many options will appear and the last item is Properties with short-cut key F8. Selecting this will bring you to another window where you can change the colors and other options such as the scale, the grid, the period separators, etc. of the Chart. By moving your cursor to the vertical scale on the extreme right of the window, the cursor will acquired a double headed arrow and you can adjust the vertical scale within certain limits.

The window that appear when you right click on any Chart will also have the Indicator List and Object List as options and selecting this will bring up the list of Indicators or the list of Objects that are appearing in the Charts; the short-cut keys are Ctrl+I and Ctrl+B respectively. Once you select any item on the list, you can then Edit or Delete it. (Ctrl+O is used for the Options short-cut key described below.)
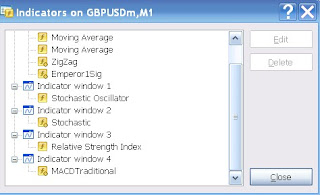
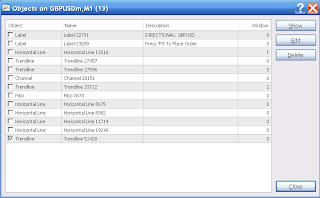
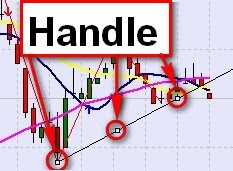
You can also select an Indicator by moving your cursor next to it and the description will appear. Right click and you can select the properties to Edit in the window that appears. You can do the same thing with an Object if that Object is already selected. How do you know if that Object is selected? An Object that is selected will have handles (or a box will appear for Texts and Labels) and you can select an Object by either clicking or double-clicking near it. Now which is which, one click or two clicks? This depends on the Option set for Objects under the Tools menu. (Short-cut key Ctrl+O). For single mouse click selection, check the box "Select object by single mouse click" or leave it unchecked for double mouse-click selection.
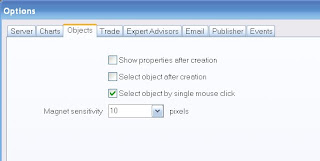
Which is better, single click or double click? Selecting by single click is faster but you can also unintentionally or unknowingly select an object when clicking on the chart. Double clicking takes twice the effort but is a surer way of selection so the choice is really yours. You can delete selected Objects by pressing the Delete key on the keyboard so if you are not careful, Objects can be easily selected with a single mouse click and then deleted by mistake.
Once an Object is selected, it can be moved by dragging it. For some Objects such as Trendlines and Fibonacci Retracement, the handles will attach to some points when you first place them and their sensitivity or closeness to the points before they are attached is determined by the "magnet sensitivity". This is also set in the same Object Option under the Tools menu as in the mouse click option above. If the line is not attached at the correct point, you can select and drag the line and anchor the extreme handles at the correct points.
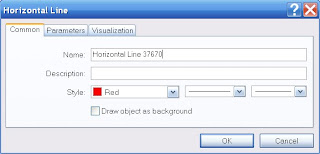
In words, it sounds rather complicating but once you try it out, it is very easy and become second nature after some practice. Every Object or Indicator will have properties that you can adjust such as color, levels, line thickness, appearance, etc. so you can customise to your own liking and preference. One of the options, Visualisation, will determine if you want the item to appear on all the Timeframes or just some selected Timeframes.